84. Largest Rectangle in Histogram
Description
Given an array of integers heights representing the histogram's bar height where the width of each bar is 1, return the area of the largest rectangle in the histogram.
Example 1:

Input: heights = [2,1,5,6,2,3]
Output: 10
Explanation: The above is a histogram where width of each bar is 1.
The largest rectangle is shown in the red area, which has an area = 10 units.
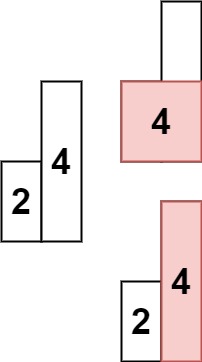
Example 2:

Input: heights = [2,4]
Output: 4
Constraints:
1 <= heights.length <= 1050 <= heights[i] <= 104
Solutions
Solution: Monotonic Stack
- Time complexity: O(n)
- Space complexity: O(n)
JavaScript
js
/**
 * @param {number[]} heights
 * @return {number}
 */
const largestRectangleArea = function (heights) {
  const stack = [];
  let result = 0;

  for (let index = 0; index <= heights.length; index++) {
    const height = heights[index] ?? 0;

    while (stack.length && heights[stack.at(-1)] >= height) {
      const last = stack.pop();
      const area = heights[last] * (index - (stack.at(-1) ?? -1) - 1);

      result = Math.max(area, result);
    }
    stack.push(index);
  }
  return result;
};